The option to enable or disable extra stock chart detail such as candles or the ability to draw chart lines.
The simplistic approach is ok for now but in the long run more info on a stock chart might be much appreciated to make more informed decisions
There has been previous discussion here
Even if making a longterm investment you might want to use TA to see if this is the best time to buy or if there is likely to be a significant drop in price in the next few hours, days, weeks or whatever. Again, when selling you might want to see if you’re better off selling that day or after a particular length of time. TA tools definitely add to the usefulness of the platform although I can’t imagine trying to do TA on the small screen of a phone.
I can imagine this has been brought up quite a few times but cant find a definite yes or no as to whether candlestick charts will be in freetrade as I really hope they will be and the sooner the better! I can only imagine that it will attract more people to using freetrade, so is there reasons as to why it wont happen?
I think you need a web interface for that or the ability to zoom. No phone screen is big enough to properly display these candlesticks.
Freetrades main rival has candlesticks and it’s very decent. I won’t paste a screenshot here otherwise I’ll have my Freetrade account banned, but I can if you PM me if you want to see.
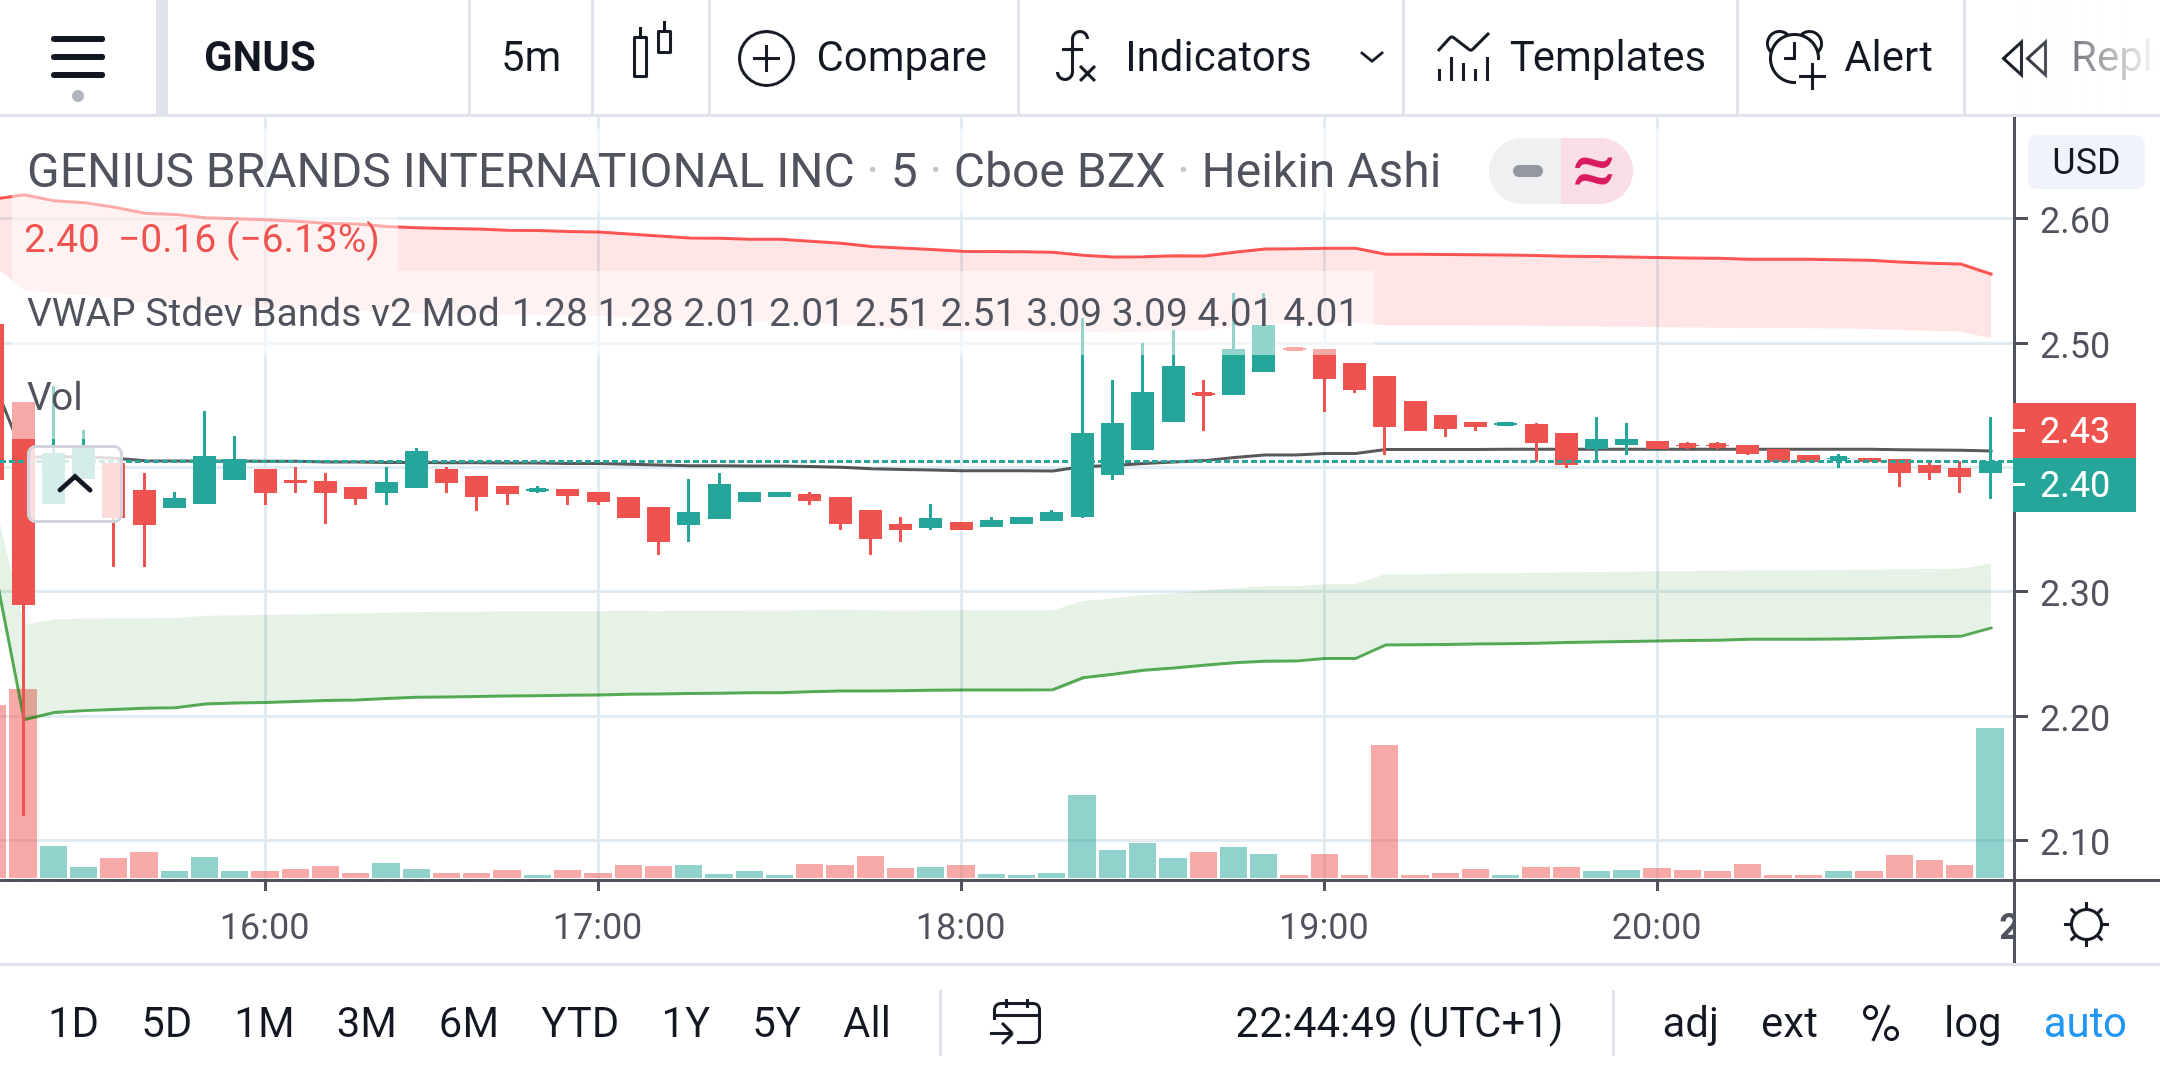
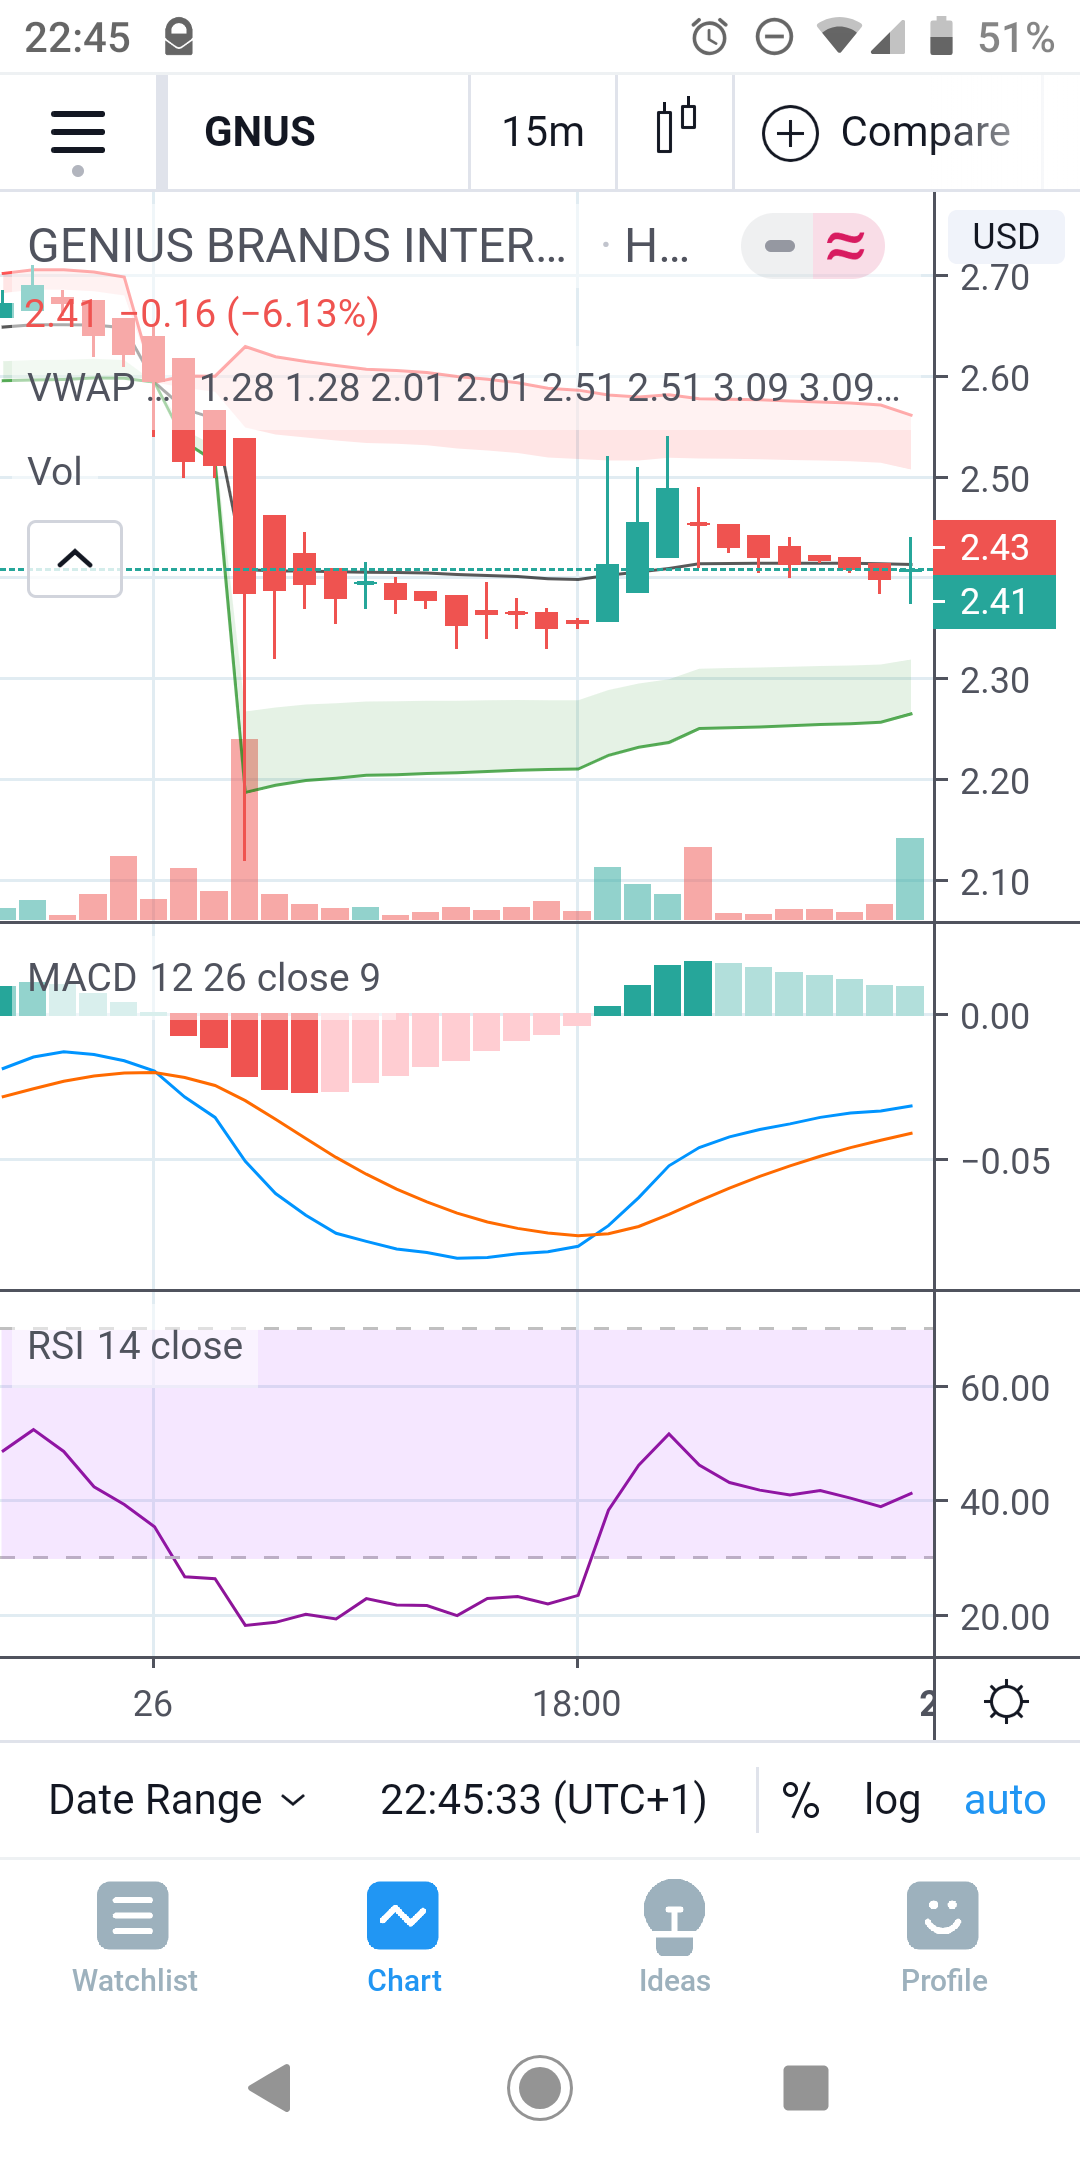
The tradingview app which I can post is pretty decent too, my 6" phone is absolutely fine to see what’s going on. The dragging and pinch and zoom works really well.
1 Like
Yeah, it can work but we first will need a zoom function. Would love them too as they can provide useful information.
1 Like
The zoom in both is the standard pinch, you can also set what one candle represents like 1m, 1h, 4h, 1d etc
![]()
![]()
It would be great to start if Freetrade charts had zoom but the curves are rubbish so zooming them would need them to be point to point too to get a better understanding.
1 Like
Everyone knows how to read a line chart. They’re self explanatory and give a quick view into a stocks past.
Candlestick graphs with volume are not self explanatory and most people don’t know how to read them. Once you learn, they’re not that difficult.
I could see candlesticks as a Freetrade Plus feature, but in a free account I think it would be counter to the companies goals of getting everyone investing. The simplicity of a line chart is good, candlesticks would scare some off.
Even in Plus, though, candlesticks could be viewed as a tool to try and time the market, which FT seem to stay away from. Just a thought, they’re obviously more informative just in general.
6 Likes
I don’t think anyone is suggesting to remove the 1D, 7D, 1M, 1Y, MAX line charts they are useful for everyone.
You would simply have another button above the chart to access the candle chart version like the competitor that shall not be named. That way it’s not putting anyone off the average retail trader.
It does need a few other key things in conjunction to make it useful like live prices and actually showing the best ask, and not a delayed mid price. Stop and limits too. Without those it’s kinda pointless.
1 Like
I really like the charts as they are but it would just be an added bonus to have the candlesticks am I wrong? Something for everyone I guess…?
Infact I have just come across the rival of freetrades people are talking about for the simple reason I wanted to know if it was actually available on an app for us Brits. I dare say its tempting to check out if I feel like making shorter term trades. Anyway fingers crossed the option is there one day (soonish)
These have come up a couple of times in our support chats & I can understand why day or swing traders / people who believe in technical analysis might try to use them.
But I’m not aware of any situations where these might be help someone make a long term investment decision so I’m wondering whether anyone in the community knows of any? To be clear, I’m not suggesting that there aren’t any - this could just be a knowledge gap.
For anyone who’s not familiar with candlestick charts, according to Wikipedia
A candlestick chart is a style of financial chart used to describe price movements of a security.
Like a combination of line-chart and a bar-chart: each bar represents all four important pieces of information for that day: The open, the close, the high and the low. Being densely packed with information, they tend to represent trading patterns over short periods of time, often a few days or a few trading sessions.

Here’s a couple of examples of what one of these charts look like, from a random website that’s designed for day traders:
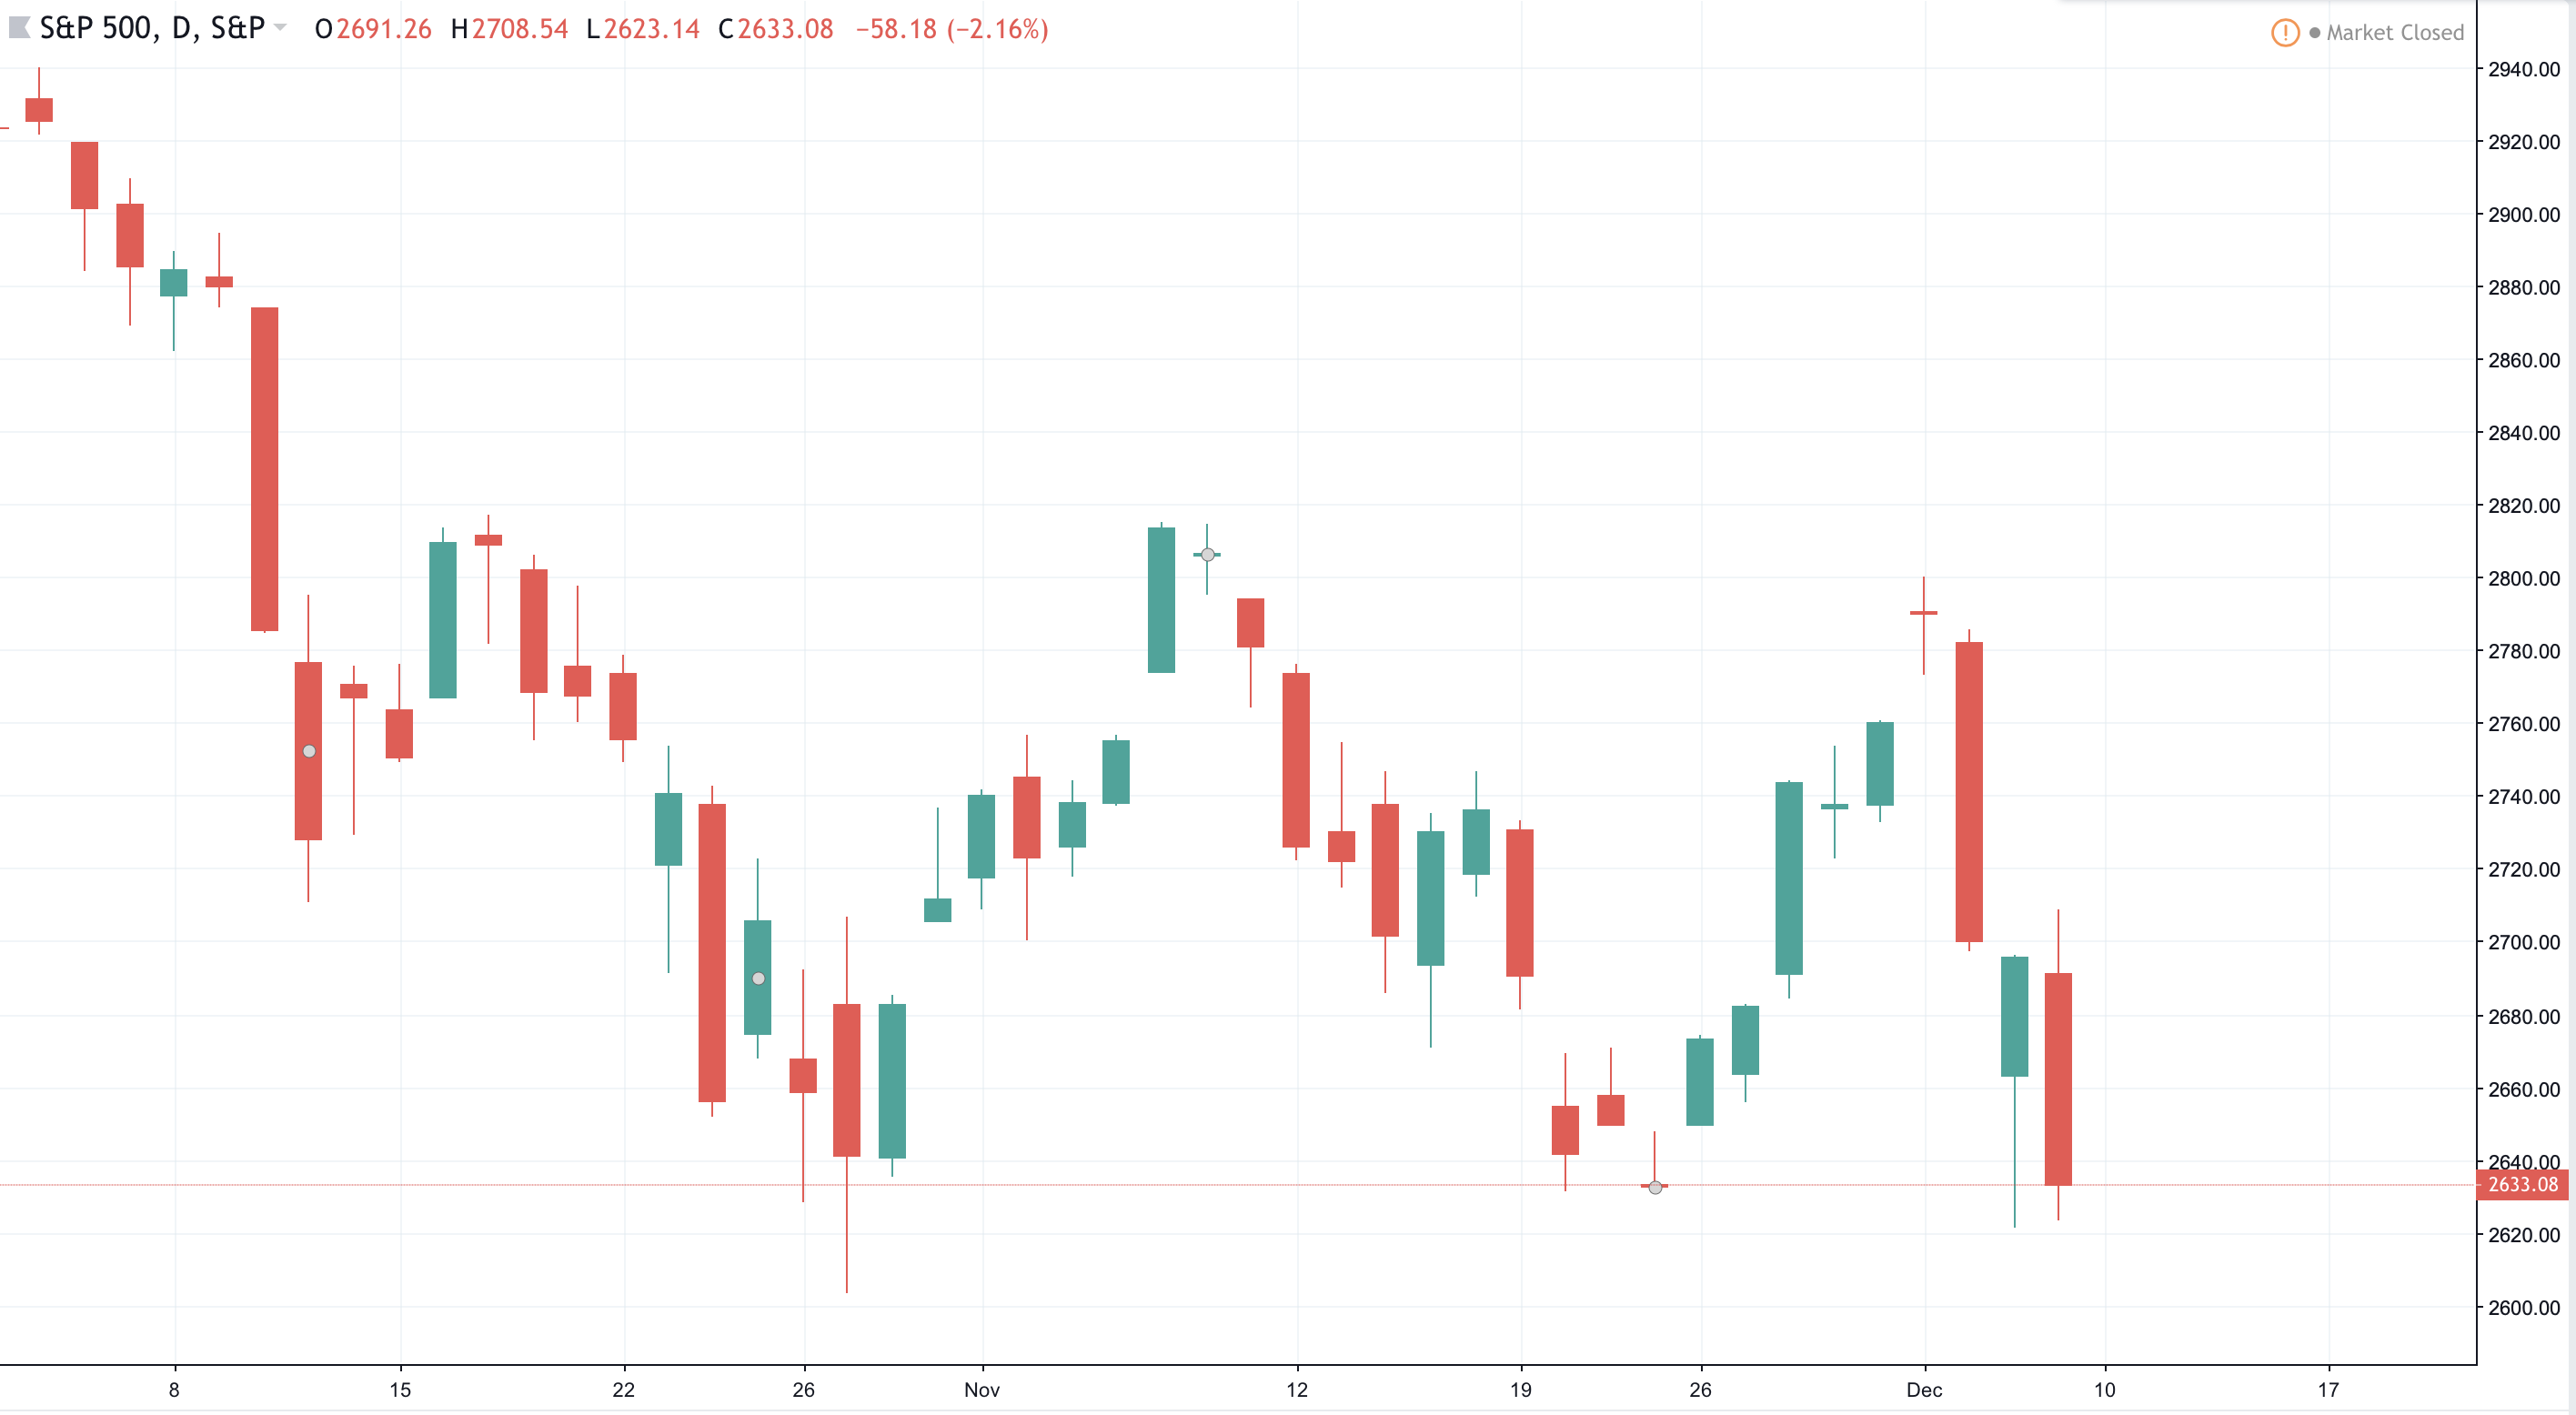

I find these very useful in terms of understanding the volatility (which normal graph cannot show if the close prices are similar).
I also believe that not every Freetrade user will benefit from these and there could a nice amicable solution - a toggle!
Mybe something like this?

5 Likes
Thanks! So how does that feed into your decision making process for making a long term investment?
1 Like
Long term - very low relevance for me personally but I am sure it may be different for more knowledgeable investors.
Short term - priceless. And not having to go to Yahoo finance for it would be great. By short I do not only mean day-trading, but a bit of swing trading. For instance, when Nvidia was 45% down recently, it went up 25% within a week (was a nice gain there!). Candlestick was quite useful ![]()
1 Like
Ok great, it’s this that I’m really curious about ![]() hopefully there’s some (even more) ‘knowledgeable investors’ who can share more about this..
hopefully there’s some (even more) ‘knowledgeable investors’ who can share more about this..
1 Like
I like them, but I suspect that’s mainly because I expect to see them. They are useful in swing trading, which is something I think freetrade will be very good for, you don’t need to buy and hold everything forever. And even on a long term trade you may want to use a bit of technical analysis to choose an entry point
3 Likes
For my investments, I don’t use them. The ability to change the date period (and hence frequency) of a line chart combined with high / low prices over a period, are sufficient for me.
However, even for long term investments, I’m sure smarter people than me would use them as a market entry tool.
1 Like
I’m sure they are useful (or reassuring) for expert investors.
The counter argument would be that as most investors are investing for the long term and are non-expert, unless they’re decumulating they should probably simply follow a “just keep buying periodically” strategy, and so they don’t even need to see daily open/close prices, let alone the movement within the day.
I don’t swing trade and I’m not expert. I don’t look at the prices at all, nor do any stock analysis - for 95% of my portfolio anyway. (I do try think about the things like aims, risk attitude, investment behaviour, asset allocation etc though.)
FT’s mission is something like opening up investment to everyone, so the consideration will be whether adding detail to something makes it better or worse for that customer base.
4 Likes
For me, these fall under the “Other places have them, so Freetrade should” category. Which I think of as a bad category in general.
On the long timeline you’re looking at for Freetrade buying, these don’t provide any useful info that a the existing chart can’t.
1 Like