Moderna Stock $12 price difference

Hi ,

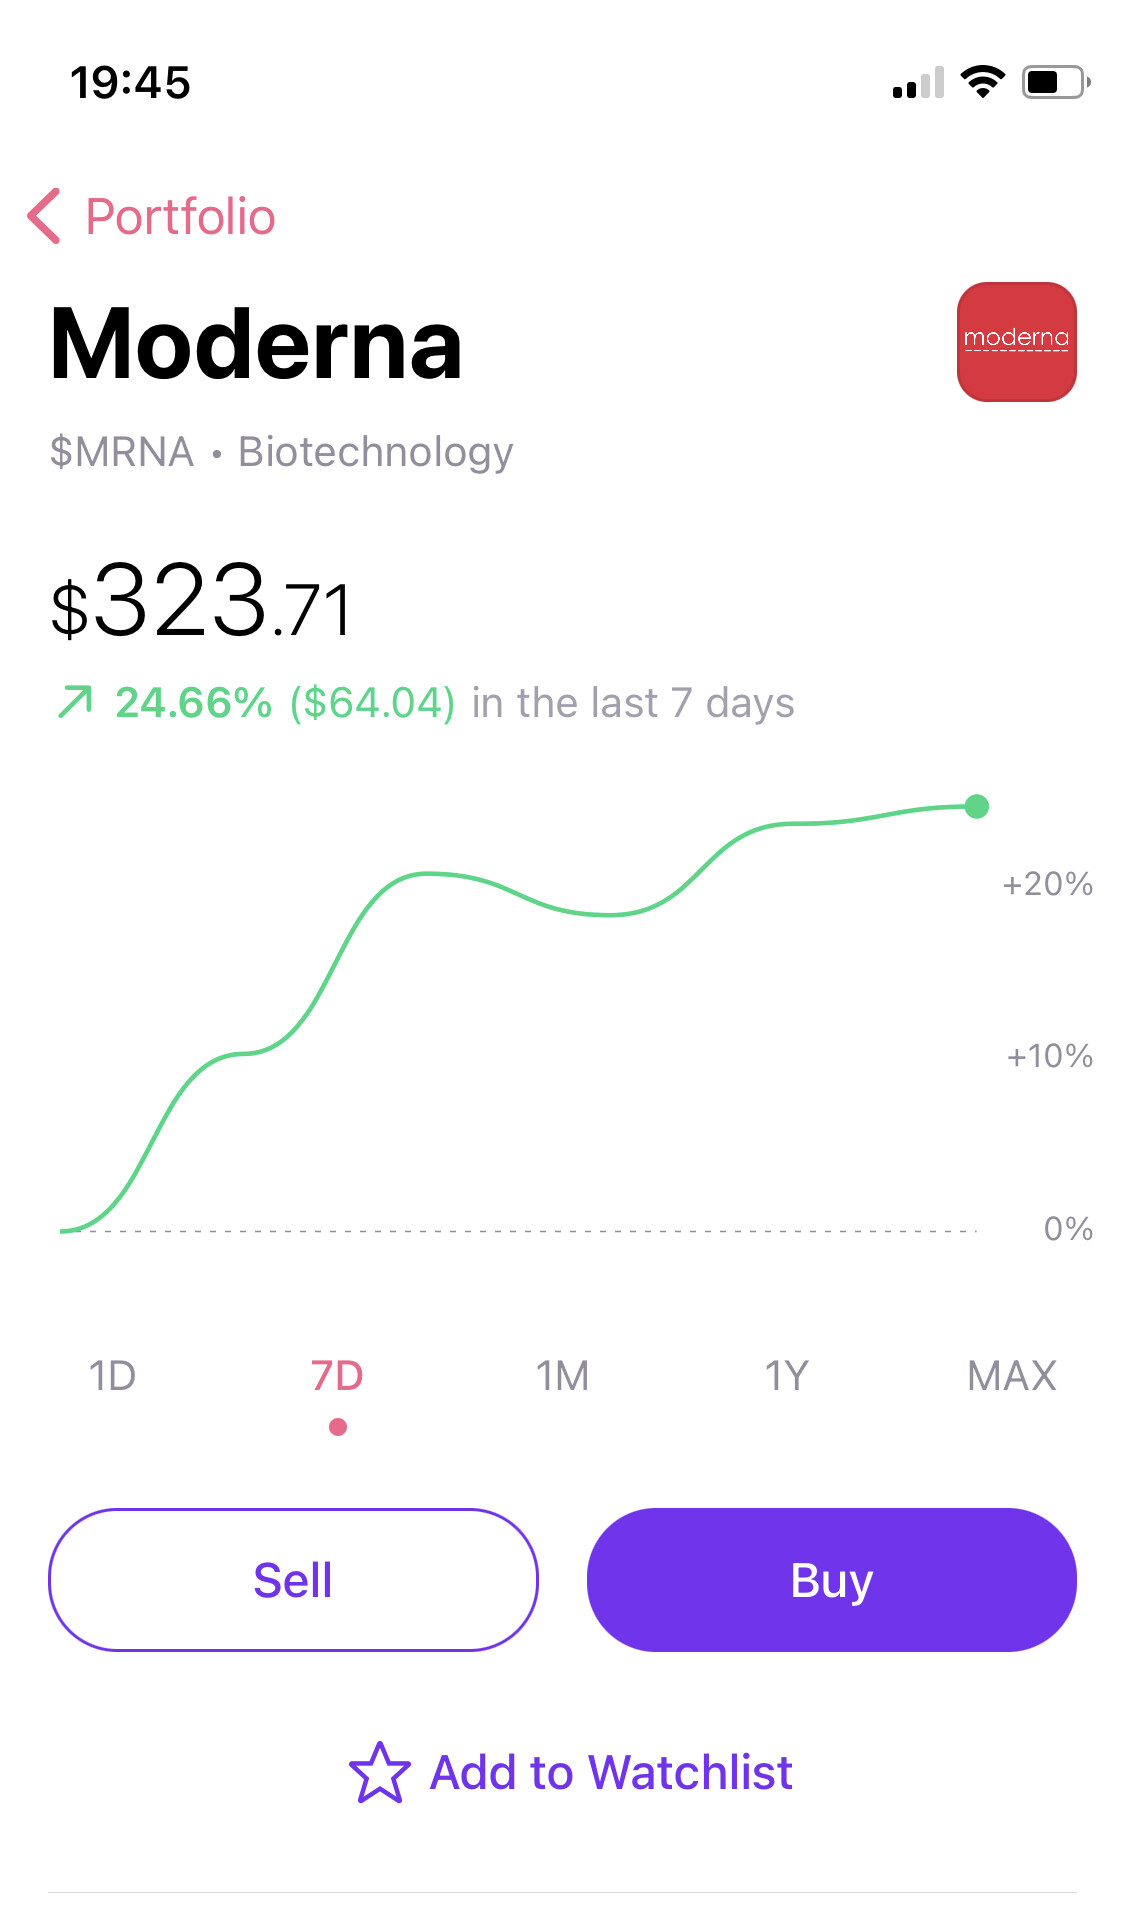
Wondering why there is almost $12 price difference for Moderna (MRNA) stock.

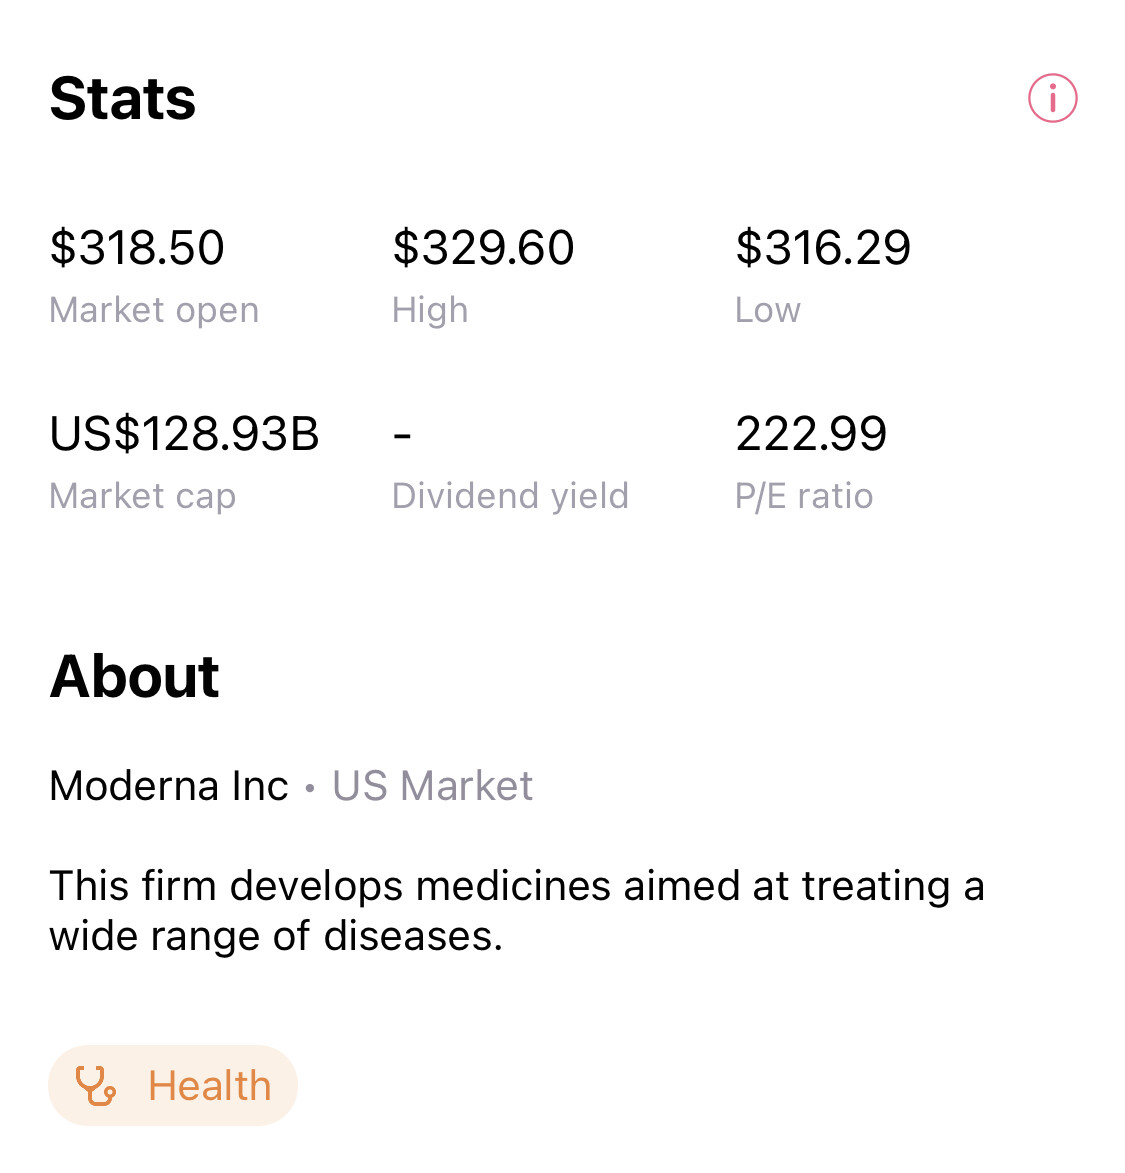
Moderna reached all time high of $342 on 20 July. Attached Yahoo finance and HL shows records . But freetrade shows $329 as all time high . As per FreeTrade Moderna stock never reached $342. Thats 3% difference in price

In a graph longer than 1D FT will show only the closing price for that day.

In stats FT shows $329.60 as High. Refer other screenshot .

I guessing they’ll pull the data at the bottom from the graph above. On the day in question It probably peaked at the $342.50 but ended at $329.60.

Umm it looks your guess is right but not good way to represent information.

Overall ft graph is bit daft- need depth , they looks way straight.it would be good if they can implement 3, 6 months , 5 years options on graph. Much like yahoo finance .

They have taken an approach of creating a clean and simple UI, the cost of this is some of the historic data.

I don’t think any should be buying investments based just in the FT info but I do agree that it can add to confusion.

1 Like

Also, I think the FT high/low prices are for the current trading day and are not all time highs/lows

1 Like

This is why I like candlestick charts. I know quite a few people on here say they are complicated and unnecessary, but in a single candlestick you have the opening and closing price and the intraday high and low, and the colour shows you instantly if it closed higher or lower than the opening price.

3 Likes

Had your post included the word β€œonly” and I would start wondering if you have the ability to read my mind from far away :joy::crazy_face:

This topic was automatically closed 416 days after the last reply. New replies are no longer allowed.