Hi, I’m new to the Freetrade forum (not the app or community platforms like this) so please do shout if I’m not going about this the correct way for this community…
I’d like the portfolio tab line graph to only show whether the value of my stocks has gone up and down, not whether I’ve added money or withdrawn it.
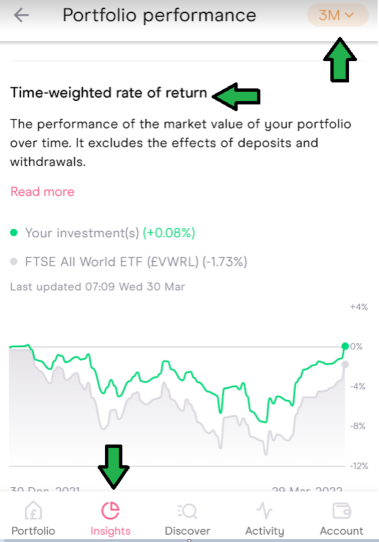
Click on Insights, Portfolio performance and then Time-weighted rate of return - this will show the performance of the market value of your portfolio over time, excluding the effects of deposits and withdrawals.
The drop down at the top right will allow you to select the period you want to check, eg 1 week, 1 month, 3 months, 1 year, etc.
I have used the insights tab and it’s helpful. But i’d prefer the chart on portfolio tab to also be without the effects of withdraws and deposits. When i add and remove money it completely skews the chart and makes it not really add much insight as its difficult to tell whether I did well today or not.
I like the chart on the portfolio tab. I like it’s positioning. I like i can do a daily view. I like that its the same look and feel and function as chart you get when you look at a single stocks line chart. I like that it is live and auto updating.
The insights chart you screenshot is a few taps away and only provides 7 days as shortest the period. It is also static rather than live data
Yeh, I tend to deposit little and often and also withdraw money relatively regularly too so does skew things. I guess some people may deposit a larger amount less frequently and for them, it would be less of an issue but I suspect I’m not alone on the little and often.
I agree with their being a lack of chart functionality. You will also find @NotMyName that when there are stock splits that share charts become almost pointless in a similar fashion.
Another niggle is that when you change the date range on your entire portfolio, the ‘Up by’ and ‘Down by’ remains set to ‘all-time’ rather than changing to match the date range as per individual share charts.
It does say “Up by £xxx Since you began investing”
The info you are looking for is all on the insights tab. Personally I prefer to have the main graph showing the growth of the portfolio including deposits.
I think the best compromise is to show a second line on the graph representing the deposits. I think there are a couple of other apps that do this.
Hey! So I don’t day trade i.e. buy and sell the same stock for a quick buck. I rather continually rebalance my portfolio (with a medium-term view) on a regular basis taking heavier positions here and there, for example. I also research new stocks and start with small buys and then gradually, over time, as I know more about the stock I’ll take a bigger position. Equally, due to the market cycle, macroeconomic events or just a change in my preference, I might decide to be less heavy in a certain area. So I’m not day trading but I am actively managing my potfolio. I’m just using the GIA, not ISA or SIPP.
Remember the benefit of Freerrade is exactly that - it’s free to trade, which makes it cheaper and easier to buy and sell small amounts on a more frequent basis than Hargeaves Lansdown that charge £12 to buy or sell.
I’m going to bump this up because I have just deposited and withdrawn a large amount from my account (well relative to the size of the portfolio) which makes the rest of it just look like a flat line…
I’m now going to have to wait a month and then a year before those graphs becomes useful again!
I know I can flip over to the insights tab and see performance but that’s a lot of extra effort. It would be better to have the most usable graph front and centre imo.
(What I actually want but I accept it’s very niche is a graph that cancels out deposits and withdraws to still show total portfolio value but without the annoying peaks that causes)
I don’t really mind seeing the deposits/withdrawals adding to the graph but I do think there should be the option to see it with and without (seperate to the time-weighted return tab)
So whenever I deposit money into my account obviously the graph has a sharp increase and basically makes it impossible to visibly see the change in my performance on the graph because of the sharp increases. I think it would be good to offer a second graph we can switch to which only tracks the change of profit/loss on our portfolio in graph form as a secondary option to the overall cash movement up/down.
So for example I deposited funds twice this month so my monthly graph looks like this:
It’s impossible to track the changes from this when you add funds because it distorts the graph for the whole week, month and max graph view But if there was a second graph we can switch to which exclusively tracks the change in our profit/loss since we started using the app rather than total cash value it would be much more helpful and improve the UX a lot.
I second that and I would like a zoom function. When I am looking at a graph, some stocks are quite volatile so I want to see what movements thy make on a smaller scale. Obviously, I can go to Yahoo Finance but that is an extra step.
I don’t find the homepage graph particularly useful, as by showing total portfolio value, when you top up your account there is a spike, which makes it difficult to see when your actual investments go up or down.
I’d propose an alternative homepage graph (maybe toggling via a config setting), maybe with the y axis being change in invested value, or maybe amount up (or down) from the total deposited?
Why can’t we have the main page just show investment progress or even a option to change to both, its so annoying when you take out say 100 pounds and see a massive drop. Now I have to look and think my investments dropped thst much, same with deposits.
No I don’t want to go look at the insights page that’s another step and also shows in percentage rather than money.
It’s in general but thanks though. My point is it’s just annoying tracking the graph everyday. Even if I never withdrew adding deposits and just having them sit in the account ruins the main graph.
I also didn’t withdraw 100 that was just an example I withdrew more as its not gaining anything sitting in my FT holdings so better to go back into my bank until I see the price I want.
I have asked about this main page issue as have many others but I guess if you don’t moan stuff doesn’t happen so I decided to moan again and will do again and again until it happens.
I want the graph to show how much the account is worth, I want it to go up when I put money in and go down if I take money out. To me it doesn’t make sense just to show investment gains with no context